Premium Features of the RetinaRisk App Explained
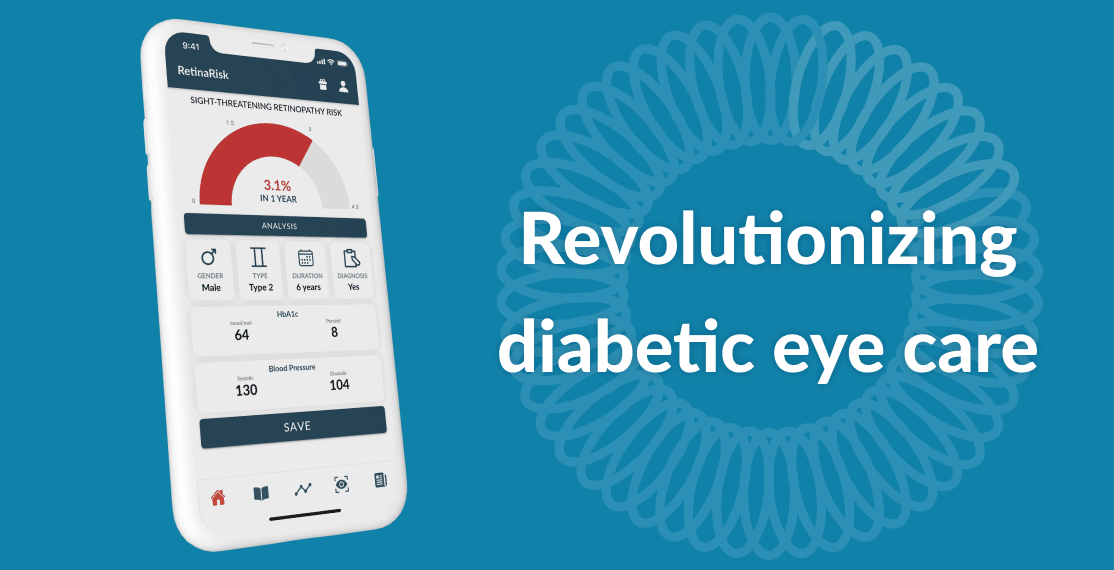
At RetinaRisk we are always working towards better eye health for our users through development of features that enhance your understanding of your health and your diabetes condition. Our main focus is empowerment and availability of information to our users and our product development focus reflects that.
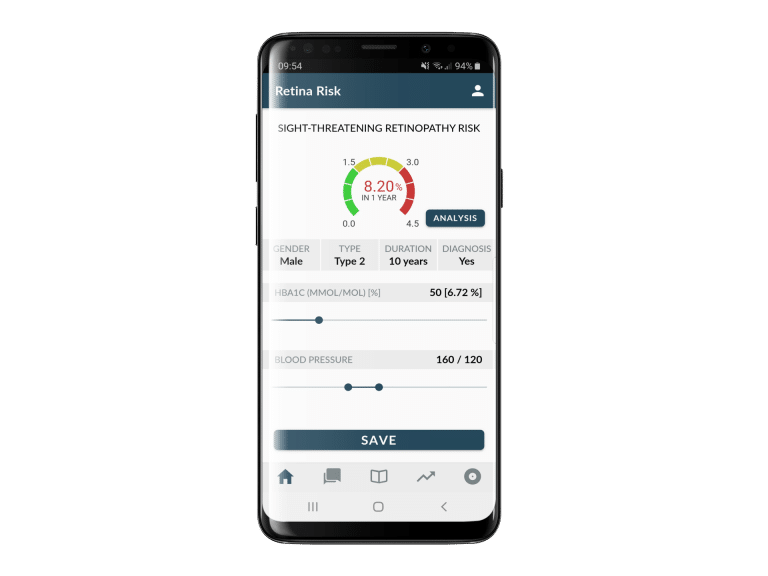
In the premium section of the RetinaRisk app, you will find tools to dig deeper into the data and find out how your risk is progressing, set goals and share your data with third parties as well as analyze your results in detail. You will also be able to register for your next eye screening and be reminded when it is approaching. We offer our app for iOS and Android.

In the trends section you can discover how your risk is progressing over time in a simple graph where the latest risk calculations are plotted along with the values from each one. Below the graph you will find a list with each calculation in more detail so you can get a better overview of which variables are changing the most and which are more stable. Over time, you will build up a more complete picture of your situation which will allow you to focus on the things that matter the most to lower your risk.
To help you discuss your risk with an ophthalmologist, a physician or anyone else, we´ve made it possible for you to export all your risk results and share them with anyone you like through email, text messages or any other means that your phone supports. This can be accessed through the icon above the chart.
To make further use of the analysis tools, you can set goals as well that are displayed on the graph. This is a great way to set goals based on the analysis of your risk where you are given optimal levels to minimize risk.
To further help you visualize your goals, we display the risk level that would result from the goals you set on the main graph so you can see how you are progressing compared with your current risk level.

The premium section also enables you to dive deeper into your risk calculation, what the risk means, what factors are driving it and how to reduce those risk factors such as high blood pressure. The analysis will show you what your HbA1c levels and blood pressure levels are compared with the possible range values. The analysis will show you what is driving your personalized risk and what you should focus on to bring down your risk of developing sight-threatening diabetic retinopathy if it is above average
We can even help in these COVID trying times! Read more here.


